US100 Price Breakout with Strong Support, But All Eyes on CPI Data for Direction

The US100, also known as the Nasdaq 100 index, has been making some significant moves recently that are worth keeping an eye on for traders. Specifically, there have been a few key levels that have been broken which are often seen as indicators of price momentum and potential future price movements.
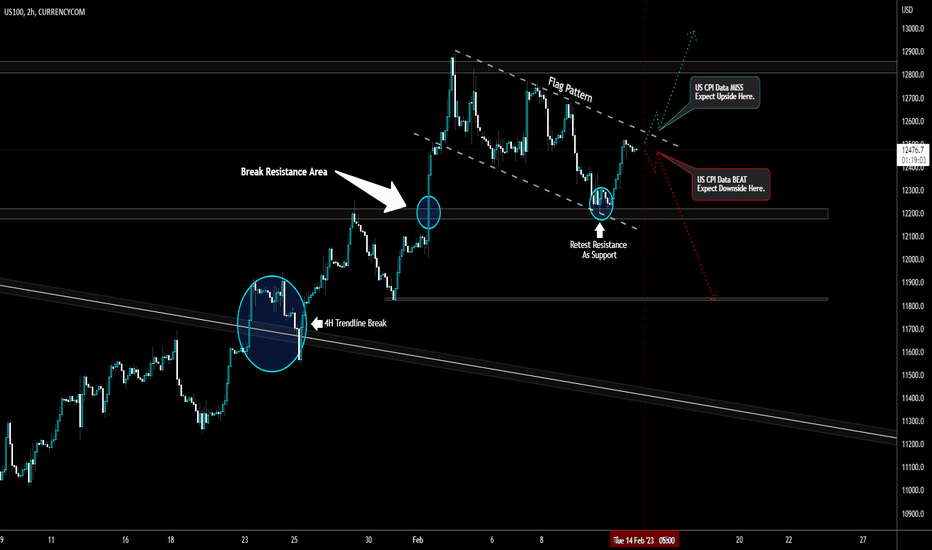
One of these key levels is the 4-hour trendline. Trendlines are often used to help identify potential areas of support or resistance for a given security or index. When prices break above or below a trendline, it can signal a potential shift in price momentum. In this case, the US100 broke above a key 4-hour trendline, which is a bullish signal that suggests prices may continue to rise in the short term.
In addition to the trendline, the US100 also recently broke through a strong resistance zone. Resistance zones are areas where prices have struggled to break through in the past. When prices do finally break through a resistance zone, it can suggest a shift in market sentiment and a potential increase in buying pressure. In this case, the US100 broke through a key resistance zone and then retested that area as support, which is another bullish signal for traders.
However, despite these bullish signals on the charts, there is an important upcoming event that may have a significant impact on future price movements for the US100. This event is the release of US CPI (Consumer Price Index) data, which is scheduled for 5:30am PST.
CPI is a measure of inflation, which is one of the most important factors that the US Federal Reserve takes into account when making decisions about interest rates and monetary policy. Inflation that is too high can be a sign of an overheating economy, which can lead to increased borrowing costs and reduced economic growth. Therefore, the Fed is constantly monitoring inflation levels and using policy tools to try to keep inflation within a certain range.
The upcoming CPI release is expected to be a major market-moving event for the US100, as well as for other markets such as currencies and bonds. If the CPI data comes in below expectations (a “miss”), this may suggest that inflation is not as much of a concern as previously thought, which could lead to increased buying pressure for the US100. On the other hand, if the CPI data comes in above expectations (a “beat”), this may suggest that inflation is a bigger concern than previously thought, which could lead to increased selling pressure for the US100.
In either case, it is important to note that the Fed’s next moves will likely be shaped by the CPI data. If inflation continues to be a concern, the Fed may take steps to raise interest rates or reduce asset purchases in order to try to curb inflation. This could have a significant impact on the US100 and other markets in the short and long term.
In summary, while the US100 has recently shown some bullish signals on the charts, traders should be cautious and pay close attention to the upcoming CPI release. The data from this release is likely to shape the Fed’s next moves and could have a significant impact on future price movements for the US100 and other markets.

